
How dirty is your fibre network?
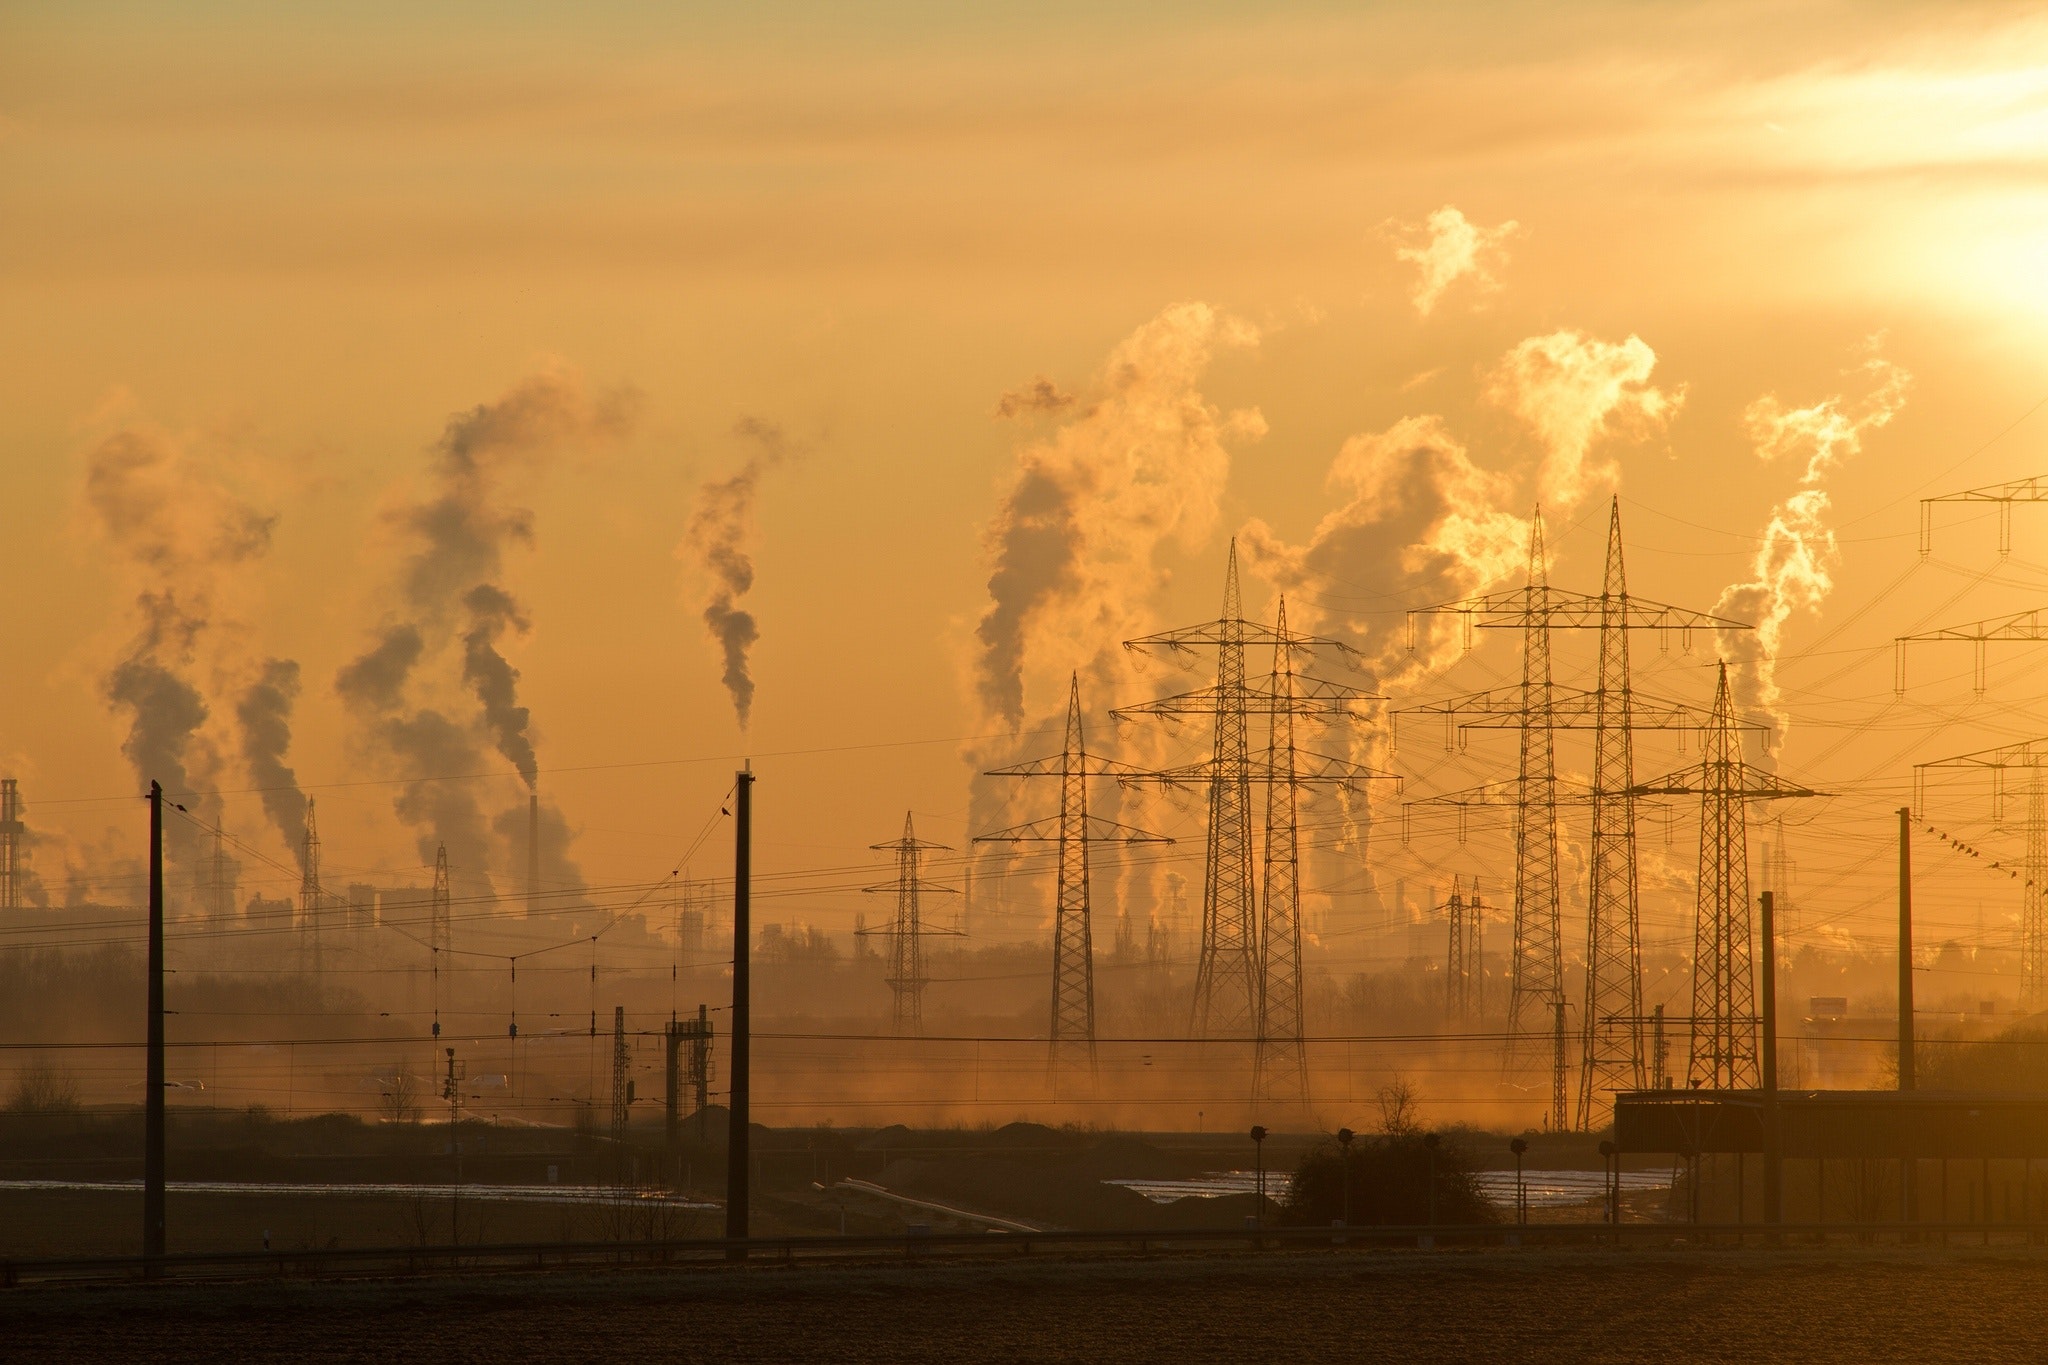
We all know that a big portion of the content in fibre networks comes from adult websites but this post is about a different kind of dirtiness, namely how coal and oil makes surfing on the Internet contribute to global warming.
It’s a well established fact that burning fossil fuel release carbon dioxide to the atmosphere which contributes to trapping heat radiated from the sun and thus the global temperature increases. Many countries burn oil or coal to generate electricity and that electricity powers the routers and switches in the network. The more dirty fuels your country use the larger the impact to the climate.
On https://www.electricitymap.org/?page=map&solar=false&remote=true&wind=false you find a live interactive map that shows how much carbon dioxide (CO2) that is released into the atmosphere for every kWh of electricity generated. The figure vary from day to day depending on what resources are at use - a cold winter day might see a lot more dirty fuels in the mix due to extra power plants needed. A windy day might increase energy from wind turbines and reduce the carbon mix.
So how much carbon is it then? Lets do some math.
A 24-port fibre switch used in the access network to connect 24 homes consumes about 30W of energy as base consumption. Add to that 26 fiber optical modules (24 homes + two uplinks) that on average needs 0.7W each and the grand total is 30 + 18.2 = 48.2W.
A day has 24 hours, a year has 8 760 hours. So in one year that switch consumes 48.2 * 8 760 hours = 422 232 Wh. Divide by 1000 to get the (k)ilowatts; 422 kWh.
Let's say that the Swedish CO2 per kWh of electricity is 55g, then that switch generates 55 * 422 = 23 210g or 23kg of CO2 emissions every year. If all of that comes from fossil fuels then it’s a net contribution to the atmosphere.
A broadband network connecting 100,000 customers might have about 4200 switches. So 100,000 fibre homes in Sweden would yield about 97 tons of CO2 per year.
Now, lets have a look at Germany. The CO2 per kWh is significantly higher, about 230g per kWh. Same calculation for 100,000 fibre homes and the result is 407 tons of CO2 per year.
Then we have Poland at around 680g CO2 per kWh. 100,000 homes in Poland would generate 1,200 tons of CO2 per year. And in Estonia with a whopping 1150g per kWh the result is more than 2,000 tons of CO2 just to surf on the Internet and just from the access equipment. Add to that the power needed for the computer, the home network switch and the core network of the operator and you can probably double or even triple the numbers.
This is one of the reasons why Waystream introduced the low power optical module that averages in on 0.3-0.4W per port instead of the 0.7W of traditional modules. At 0.3W in the same scenario as above the switch power consumption is cut down to 331 kWh per year. Recalculating the CO2 emissions from the example above with 100,000 homes connected then looks like this
Table: CO2 emission in tons per year for 100,000 connected homes based on snapshot carbon mix 2019-02-11 from electrocitymap.org.
| Country | Standard SFP | Waystream Superlowpower SFP |
| Sweden | 97 | 76 |
| Germany | 407 | 319 |
| Poland | 1200 | 945 |
| Estonia | 2000 | 1600 |
Using lowpower optical modules in the network equipment has a significant impact on the carbon footprint of your fibre network. It also has an impact on your wallet. Less power consumed means lower power bill, and for those that also have to use air-conditioning to keep the equipment cool during hot summer days, well… less heat generated means less cooling and an additional saving of cooling costs.
Good for the climate, good for the power bill and good for the cooling costs.
That’s a win-win-win situation.